
When you drink
Explore daily trends, weekdays, and times of day. See days with entries alongside days without logs.
See how much you drink and spend over time. Compare days, drinks, and places to find where your totals add up.
Explore your insightsTwenty drinks have prices. Four prices are missing.
Choose Today, This week, This month, 7 days, 30 days, 90 days, or All time. Compare your logged drinking and spending across periods.
Start your week on Sunday or Monday. Calendar days, weeks, and months follow your device’s local time zone. The 7-, 30-, and 90-day views include today and the preceding calendar dates; counter widgets also offer rolling periods, such as the last 24 hours. Time labels follow your phone’s 12- or 24-hour clock setting.
Period insights highlights changes in your recorded totals. Open a finding to see the supporting entries and what the comparison includes. Calculated findings work offline on every phone that runs PourTally, with no AI model needed.
Explore daily trends, weekdays, and times of day. See days with entries alongside days without logs.
See which drinks appear most often and how they contribute to your logged totals.
Track recorded costs, averages, spending trends, and the drinks or places that cost the most. Each currency has its own totals.
Compare tagged places by entries, days, nutrition, and recorded spending. See how many entries have a location and price.
A few drinks at a time can add up. Record the price per drink to see what you’ve spent, your average cost, and which drinks and places account for it.
Prices are optional and entered by you. PourTally does not connect to bank accounts or fill in missing costs.
Recorded spending · USD
$146.0020 of 24 drinks have prices.
4 missing prices are excluded from spending, not counted as free drinks.
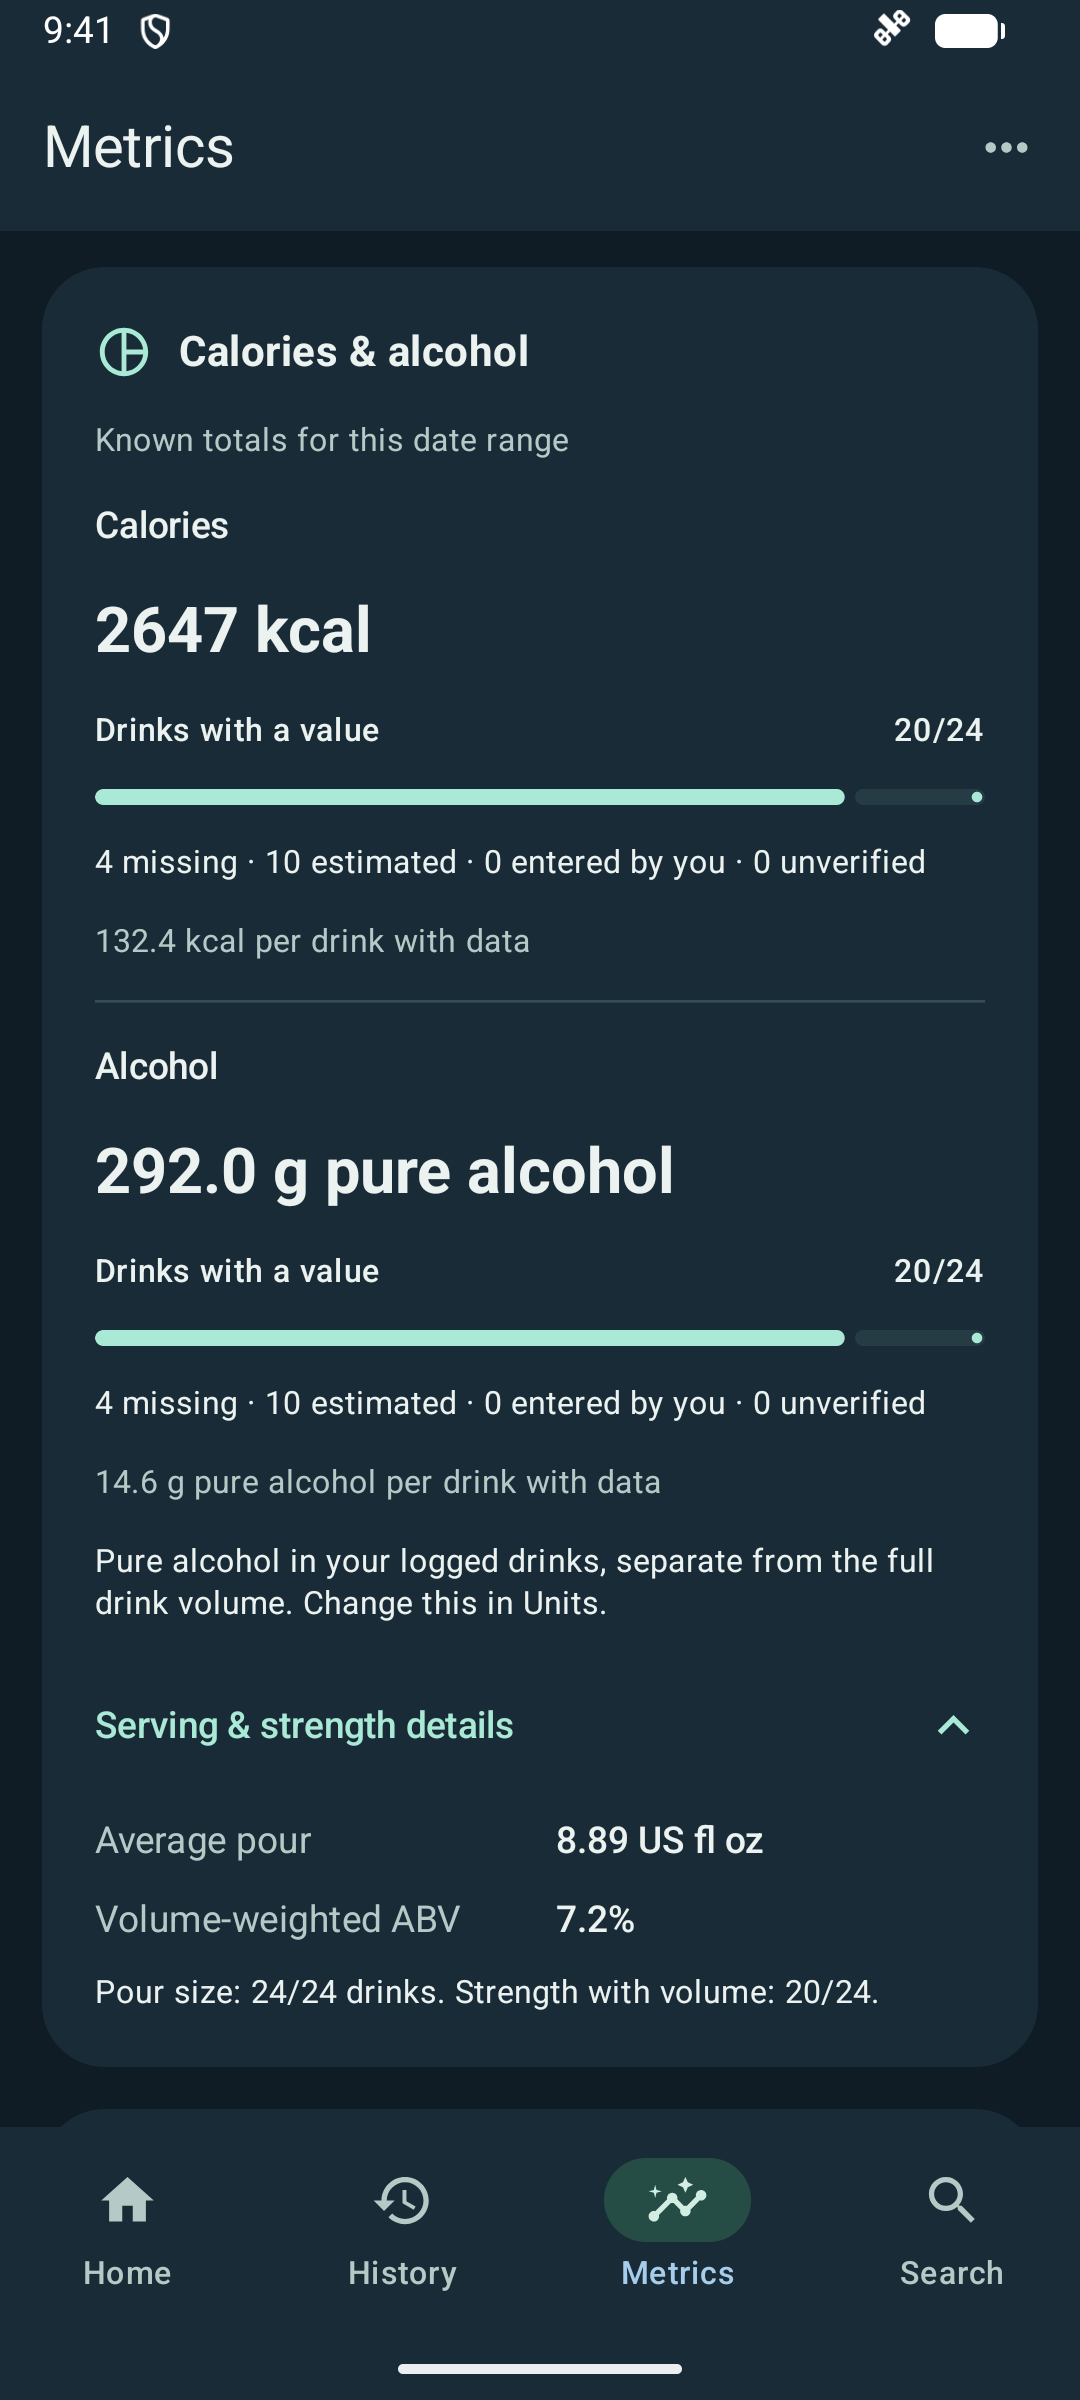
Nutrition totals should tell you what’s included. PourTally separates published, estimated, entered, and unknown values instead of quietly filling in the blanks.
4 missing values stay visible. They are not counted as zero.
Illustrative coverage example.Serving and alcohol units change the display, not your saved history. Alcohol totals default to grams of pure alcohol; milliliters and US standard drinks (14 g each) are also available in Units.
17 of 24 drinks include a place
Compare drinks and recorded spending by place. Entries without a location still count toward your overall totals.
Place comparisons include only the entries you tag. Price and location coverage show how much of your history each comparison represents.
See location optionsOptional local AI explanations are available on supported phones with a ready model, or after a model download you choose to start. Wi-Fi is recommended; the download may be large. Calculated insights remain available without AI. Privacy details.
Cutting back or keeping track. Start with the numbers.